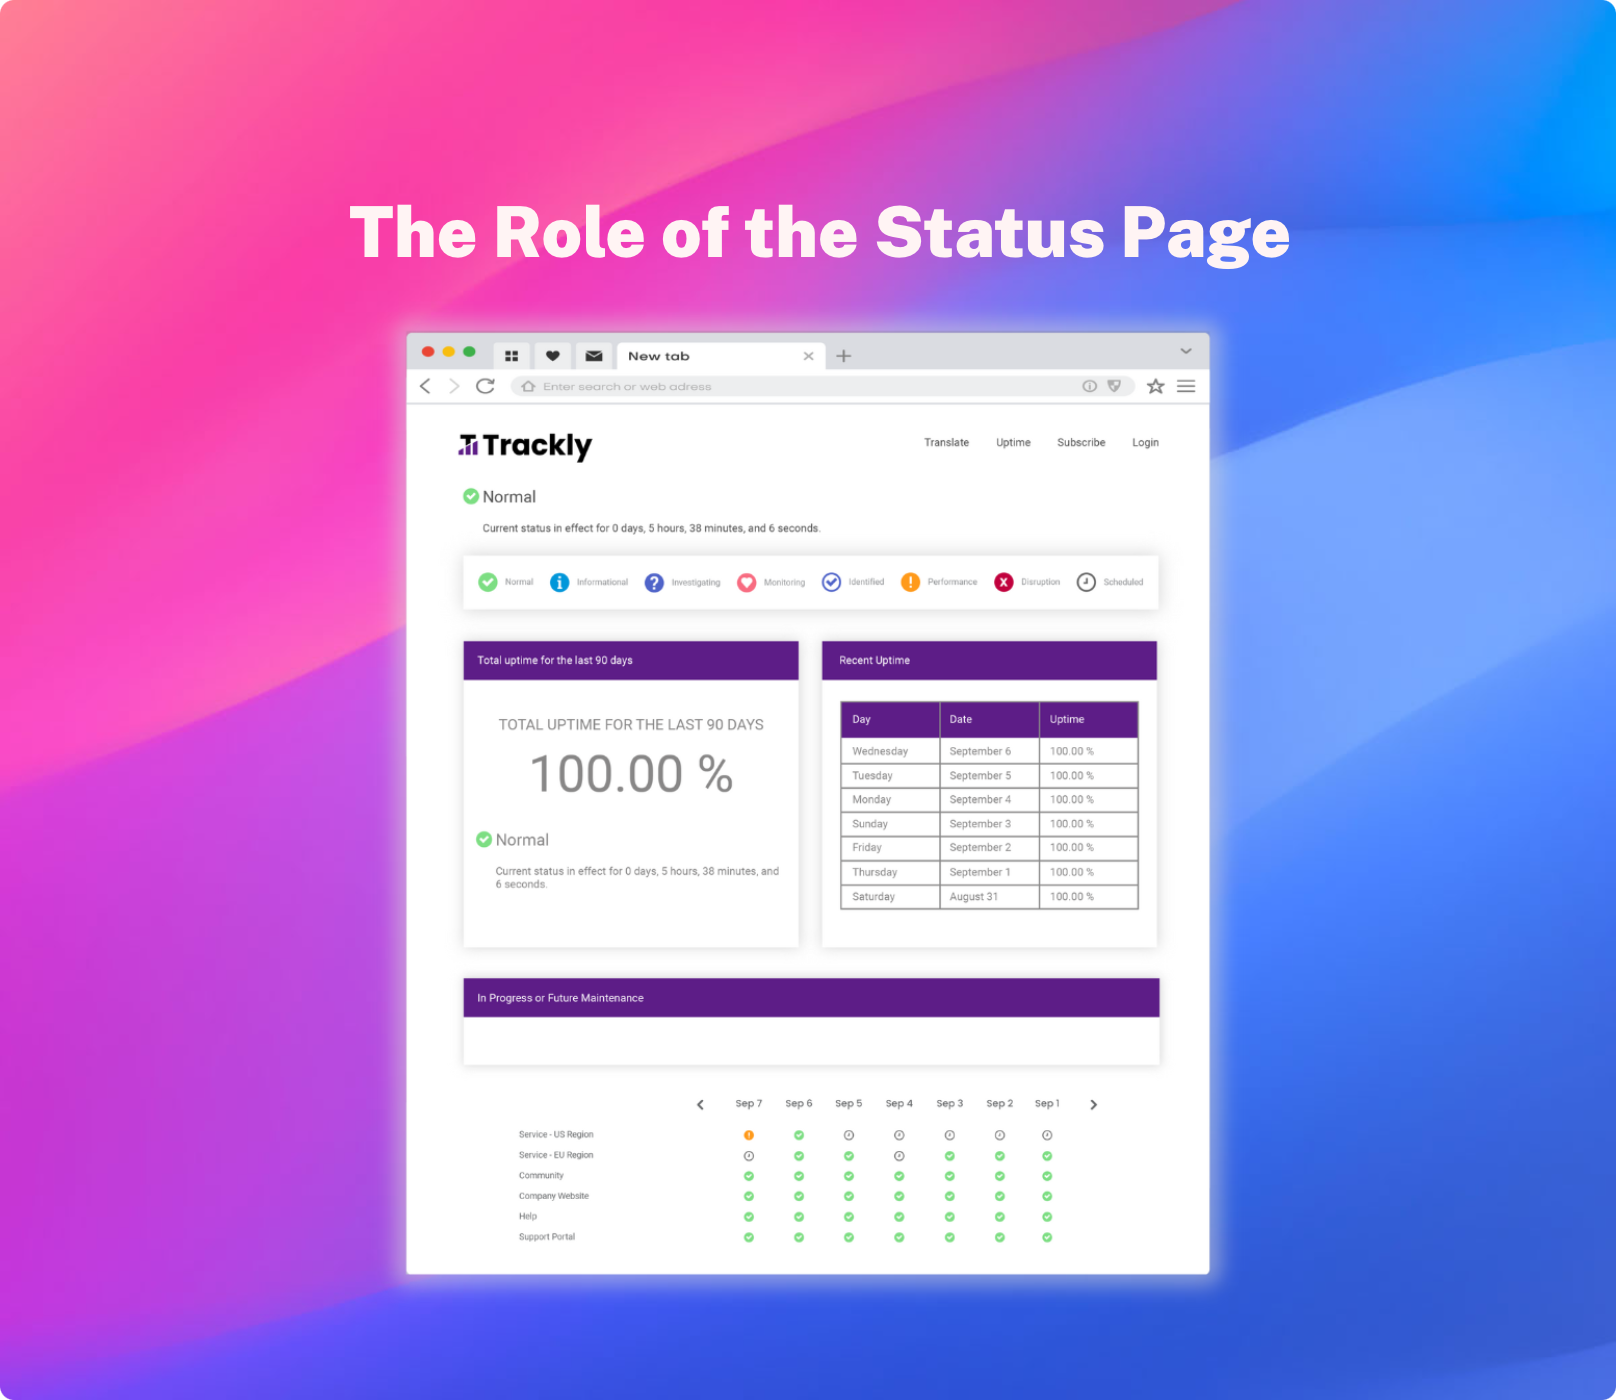
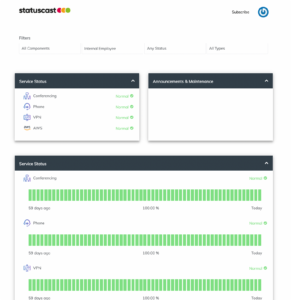
StatusCast helps corporations keep their employees happy by providing unified IT status pages and notifications, which gives them the ability to communicate IT status updates with their employees from a single location.
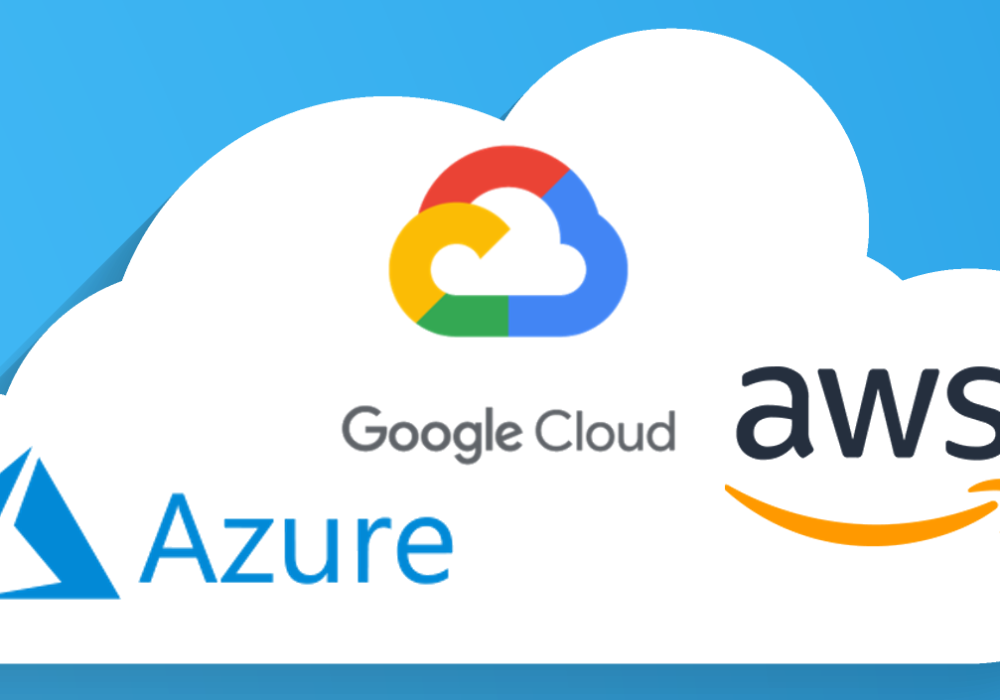
Having to check both a corporate IT status page and a separate one for the organization’s cloud provider to determine the extent of IT issues, lowers employee productivity and job satisfaction. To address this issue, StatusCast has extended its core platform to provide integrations with third party SaaS applications. In addition to integration with Office 365, which was announced earlier this year, StatusCast also integrates with the “Big 3” cloud providers – Amazon Web Services, Microsoft Azure and Google Cloud. For organizations using any of these providers, they can link their status page to the cloud provider directly, resulting in a unified status page for their employees that provides updates on internal IT systems and applications as well as cloud services.
With 81 percent of enterprises operating multi-cloud landscapes and 26 percent spending over $6 million annually on public cloud infrastructure, staying on top has never been harder, according to Marc Wilczek, Navigating The Digital Universe, CIO.
Today’s corporate IT environment is more complex than ever with enterprise adoption of multi-cloud landscapes hovering around 90%. Layering this complexity on top of myriad business applications, databases, hardware, IT infrastructure and network connectivity means that IT teams must work harder than ever to keep employees informed of IT-related issues and downtime.
That’s where StatusCast can help. With integration of the “Big 3” cloud providers with your corporate StatusCast status page, cloud incidents can now flow seamlessly from your cloud provider to your StatusCast status page and incident management system, providing a unified IT status notification solution.
Within StatusCast’s administration module, you have full control over how this information is propagated to your employees:
In today's fast-paced digital landscape, businesses rely on multiple cloud services and applications for their daily operations. As a result, cloud incident response is crucial in identifying, responding, and resolving service outages or disruptions. StatusCast's IT status page software seamlessly integrates with status pages from AWS incident response, Azure incident response, and Google incident response suites, allowing your users to rely on one source of truth instead of bouncing between multiple status pages.
StatusCast's platform simplifies the cloud incident management process by aggregating service and application status monitoring in one centralized location. By consolidating all critical information, our software makes it easier for your organization to analyze logs, identify threats, and ensure effective communication during service outages.
StatusCast's IT status page software supports best practices for incident response in the cloud by providing a range of tools and resources to help your team respond quickly and effectively. Key features of our platform include:
StatusCast's IT status page software is designed to keep your employees productive during service outages. By providing a single source of truth for all relevant cloud services, our platform helps users quickly identify the cause of an issue and find alternative solutions to continue their work. This not only reduces the real costs of downtime but also ensures a positive customer experience.
Keeping your employees informed of IT incidents helps them maintain optimal productivity. In addition, it frees your IT help desk staff from the flood of inbound calls and tickets that typically arise during an outage. Freeing up IT help desk staff can result in considerable cost savings, especially as IT environments become increasingly complex. Check out our IT Status Page ROI Calculator to determine how much you could save with a StatusCast status page. If you don’t already have a private, employee-facing status page to help manage this process, now is the time to consider getting one.
To learn more about StatusCast and get your team’s private status page up and running, sign up for our free trial.
If you’re an Office 365 administrator, you know that accessing the Office 365 Service Status page can be somewhat time consuming and complicated. It’s no surprise that when there’s an O365 outage, your employees come running to you instead of looking up the problem on their own. This can be a huge drain on IT help desk resources.
Unlike most SaaS public pages, the Office365 status page is a private status page. The O365 architecture is not a purely multi-tenant service. This means that Microsoft can’t provide a single status page for all of their customers. Your version of O365 is provisioned differently than everyone else, therefore Microsoft has chosen to provide a unique status page experience to every customer. The O365 status page is only accessible behind your authenticated O365 user account.
With the integration of O365 on to your corporate StatusCast status page, Office 365 incidents now flow seamlessly from your private O365 account in to your status page and incident management solution. From within StatusCast’s administration, you have full control as to how this information is propagated to your employees:
We all know that getting relevant information to employees about ongoing IT incidents is critical. By ensuring the company knows what’s going on within your business IT infrastructure, employees maintain optimum productivity. More importantly, your IT help desk is saved from the flood of inbound tickets that typically arise during an outage. If you don’t already have a private, employee facing status page to help manage this process, now is the time to consider getting one.
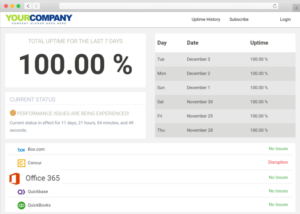
The easiest way to get a status page up and running for you employees is to include all of their favorite existing SaaS products. Most SaaS companies have their own status page, however, ensuring all your employees know about them and are using them properly can be painful. When your employees are directly responsible for watching SaaS outages, you lose the ability to ensure they are watching, or to track and control the message they are delivered.
A status page service like StatusCast lets you consolidate the status of all your SaaS providers onto your internal page, and thereby control the workflow, notification process, and messaging.
According to the article 2018’s Top Business Apps in Inc. Magazine Office 365 is the most popular SaaS business application on the market today. Followed by Salesforce, Amazon Web Services, Google GSuite, Box, Slack, SAP Concur, Jira, Zoom, and Cisco Meraki. With this integration, StatusCast now officially integrates with 9 of them.
This is the third video in our blog series, Setting Up Different Status Page Integrations.
To provide some context, last month, our product manager, Eric Warth put together a few quick (3-5 min) videos to help new users with some of the basics of setting up your software status page. I’ll be sharing them one at a time on this blog, but you can view them as we post them up on YouTube here.
The point of a status page is to inform end-users when there’s a performance issue with software or devices they rely upon to do their respective jobs.
When end-users encounter an issue (whether they’re customers and it’s a SaaS product of yours, or whether they’re coworkers and it’s office-wide software your IT team is responsible for), requests for information are going to come to your IT/DevOps team. The team will either answer these requests—and be distracted from resolving the actual issue—or they’ll focus on solving the problem, and ignore the escalating volume and intensity of inquiries coming at them. Obviously, neither of these is a desirable scenario.
A status page integrated with your APM tool(s) eliminates the need for your IT team to respond to disruptive requests while still providing end-users with timely, transparent communication about the uptime status of the tools they’re currently experiencing issues with.
When integrated with StatusCast, your APM will actually automatically trigger a notification to end-users when it detects an issue with the software or devices it’s been designed to monitor. As Eric discusses in the video, you can set these alerts to send immediately, after a delay, or not at all until they receive manual approval—so while these alerts can be automatic, they don’t need to be.
As mentioned above, transparent, timely communication of uptime status to your end users is important to mitigate the level of frustration they likely feel when they can’t do their jobs because of application performance issues.
It’s important to note, communicating uptime status can be proactive as well – if you have scheduled maintenance for instance, your end-users would likely appreciate being notified ahead of time (and likely would also appreciate being notified several times, perhaps the week before, the day before and a few times the day of). This can be achieved with a status page as well.
Best practice is to offer your end-users multiple means of subscribing to updates – this makes end-users less likely to complain about not having seen updates and also less likely to view your uptime status updates as spam.
Twitter, text/SMS, and email are popular but by no means are the only methods of communication. Messaging apps like Slack or HipChat can be integrated as well, if your end-users would prefer to receive uptime status alerts via those channels.
By setting up these notifications ahead of time, your DevOps or Marketing team (or whomever you task with creating the end-user-facing alerts), can be free to direct their attention to more demanding tasks, rather than to generic communication that could easily have been automated.
Like most application performance monitoring software (APM) solutions, SiteScope is designed to help your IT team spend less time struggling with incidents and instead spend more time identifying and mitigating risks before they become incidents.
Similarly, the status page software StatusCast is designed to take the burden of communicating about scheduled maintenance, unplanned downtime, and other uptime-related alerts and updates off of your IT team.
Together, these tools empower your IT team to focus on the ounce of prevention rather than the pound of treatment.
Technologically speaking – how can these tools work together?
SiteScope can run on Windows, UNIX, and Linux platforms. It monitors more than 100 different target types for critical health and performance characteristics (including tools from Amazon, Hadoop, Cisco, Citrix, Microsoft, Oracle/Sun, SAP, SAS, Siebel, VMware, WebLogic and other custom monitors via the Live Network), and bridges the gap from IT pro to typical end-user through its integration with application status page tools like StatusCast.
SiteScope also integrates with other products and services, most notably Operations Manager (proactively performs root cause analysis) and Performance Center (facilitates application performance testing). SiteScope’s integration with Operations Manager actually allows for agentless monitoring across heterogeneous IT infrastructure components. This is significant because without an agent infrastructure in place, most APM tools can only monitor network components on the same environment.
This provides your customers with transparency about the performance of your application. StatusCast can send updates to your end users immediately, it can be set to wait a certain amount of time before sending updates, or it can be set to not send any updates without manual intervention (see workflows below, under Step 2. Automate incident posting). Likely you will send different updates at each of the three settings, as some issues are best handled by immediate transparency with the customer, others are better communicated after they’re better understood by your team, and some may require human attention before being sent out at all.
StatusCast makes communicating with your end users an easy task, without compromising the quality of that communication. This is because you are using information you already have at your fingertips—in SiteScope—and merely applying that information to another audience (after a bit of polishing)—your end users!
Copy your API Key, navigate to the Integrations section of your StatusCast admin portal [yourapp].statuscast.com/admin), and select the Install button under HP SiteScope.
Choose HP SiteScope from the Choose Provider drop down.
Next, select the Alert Name from the list (this will correspond to a specific application in your SiteScope account). Enter a name for Authored by, which defines who is the author of each incident. Just like normal incidents, a post can have only a single author:
The other Incident settings, including Type, Affected components, Subject, and Message, reflect the same general options you have when creating an incident. For more information on this process, please refer to StatusCast’s article How Do I Post a New Incident or Status?
At this point you can set up a workflow for the incident:
Once you set all the configurations, click Submit to save the configuration.
To configure the metric, navigate to the Layout section. Drag the Metric widget into your pages layout, select the pencil edit icon, and select New Metric.
From here you can configure the metric you’d like to display:
Display name: Enter a friendly name to identify this metric within StatusCast.
Choose provider: Select HP SiteScope as your provider.
Choose application: Select the application from your SiteScope account from which you want metric data made available to StatusCast.
Metric: Select the type of metric you wish to make available, e.g., Response Time.
Select Save to add the SiteScope metric to your layout, and to finalize these changes, select the Save & Publish option on the right.
Now that your metric has been added to your StatusCast page, navigate to the page to see it in action!
I hope this blog has helped you understand some of the monitoring capabilities of SiteScope and what an integration with StatusCast can do for you.
The three primary goals of a hosted status page are:
Similarly, using a webhook integration, StatusCast pulls designated alerts from PagerDuty, allows you to rephrase them into terms more relevant to your end-users, and sends them out to impacted users via each individual user’s preferred communication channel. As with all status updates in StatusCast, you can program them to send immediately, to send automatically but with a time delay, or to require manual approval before being sent at all.
StatusCast helps you bridge the customer experience gap by sending out alerts based on affected components (meaning only impacted customers receive the communication), and sending them out through the communications channel your customers have identified themselves to be most effective for status updates.
StatusCast is built with a similar idea in mind – though downtime is unlikely, to an extent it is unavoidable. Rather than deny that unpleasant truth, better to be prepared to handle it professionally. By providing the history of uptime on your hosted status page, you are reminding customers when downtime occurs that it is a rare occurrence rather than the norm.
One of the reasons StatusCast was built as a hosted status page tool in the first place was to help IT/DevOps focus on resolving the issues impeding application performance, by taking the burden of communicating about the issue and its resolution off of that team’s shoulders. By working with another team (for instance Marketing) in advance, to ensure the customer-facing alert language is user-friendly but accurate, IT/DevOps can free themselves to focus on what they do best when the need for their timely attention is at its greatest.
I’ve written on the StatusCast blog before about integration between a status page and application monitoring tools, namely WHY you would want to. This post is designed to be more of a teaser look at the many options you have for HOW.
Binary Canary operates from the philosophy that downtime is bound to occur – resources and energy should instead be invested into streamlining the process for identifying, repairing and communicating problems to customers as much as possible.
New Relic allows SaaS companies to monitor and boost performance for their entire web-based application environment. Click the above link to see a step-by-step guide for completing the integration between New Relic’s application monitoring and StatusCast’s status page.
Paessler utilizes remote probes, sensor types and push notifications to keep you informed about network availability, performance and usage.
Panopta combines globally-distributed network service checking with an on-server agent and a virtual appliance, to ensure all aspects of your infrastructure are being monitored, with precision.
As with other application monitoring tools, Pingdom is able to filter out false alerts and analyze performance from the user’s perspective. It focuses on key transactional parts of your website or web-based application (e.g. login, search, make purchases) and ensures that they are not experiencing issues.
Uptime Robot is a free application monitoring tool that includes many of the features the paid alternatives offer. Though they still offer a free plan, earlier this year they released a Pro Plan as well. The Pro Plan monitors at more frequent intervals, can accommodate additional monitors, and retains a longer period of logging.
The above are just a sampling of the different application monitoring tools StatusCast integrates with. If you are looking to integrate a status page with your company’s solution, please contact us for more information.
Uptime status is only fully reflected in systems that measure activity on both sides –the server side and the user side. Paessler AG’s suite of network monitoring solutions equips software companies to do just that – managing network availability, performance and usage efficiently. It accomplishes this through remote probes, differentiated sensor types, and push notifications.
Remote probes allow you to monitor diverse networks, for instance subsidiaries, independent networks within your company, and most importantly your customers’ networks. This allows you to determine with greater accuracy whether your end users are experiencing performance issues or not and if so, precisely where the source of the issue resides.
With over 200 sensor types available “out of the box” and the ability to monitor as many as 20,000 sensors per installation through Paessler Router Traffic Grapher (PRTG) Network Monitor, network monitoring can be tailored to your needs. Even a netbook can monitor on average 1,500 sensors, meaning the demand of PRTG on your system is minimal.
The ability to send IT/DevOps push notifications via the preferred communication channel (e.g. email, text messaging, etc.) means that you can ensure the right person knows at the right time when there is a slow or failing sensor, or when sensor channels break predefined threshold values (i.e. when there’s a problem).
What does all of this have to do with sharing uptime status? StatusCast has been built to integrate with application performance monitoring (APM) solutions like Paessler’s to translate the information your IT/DevOps team receives from tools like PRTG into an update your end users can understand. Just like DevOps can receive push notifications from PRTG when the network is experiencing issues, you can allow your end users to subscribe to alerts via their preferred communication method.
Though they will never appreciate problems with accessing or using your application, end users do appreciate the transparency and convenience of a timely uptime status. By providing this in language they can understand (i.e. non-tech literate) and in a way that does not take time and attention away from IT/DevOps when they need to be focusing on repairing the issue itself, you are ensuring service disruptions have the minimum impact possible on your customers and as a result on your business.
As with New Relic, Pingdom can transmit uptime and other performance data to hosted status pages automatically and translate that data into terms relevant to your customers. This is achieved through an integration with StatusCast. Just as Pingdom sends you (or your IT team) a notification, StatusCast sends a notification to those customers impacted by the application outage (or whatever other performance issue there may be). In this manner,
StatusCast helps you get ahead of the wave of confusion and frustration from customers as a result of unexpected application downtime.
Much of customer confusion and frustration can be avoided by simply doing a better job at setting expectations.
A hosted status page can serve as the go-to means for customers to find out when your application will be unavailable due to scheduled maintenance or to periodic testing for things like system stress and disaster recovery.
As an additional benefit, StatusCast is designed to be simple enough that non-technical staff can use it. Once your DevOps or IT team clarifies what audiences are impacted by what triggers in Pingdom (or whatever APM you’re using), your Marketing team can take care of actually crafting a message that your average end user can understand, that appropriately sets expectations with your end user customers, and that includes other relevant information you’d want those customers to be aware of. This empowers Marketing to do what they do best.
Image courtesy of the Pingdom blog.
The StatusCast team has worked in the SaaS world for over a decade and as a result, we understand that this kind of unfiltered, real-time updating is not appropriate for every hosted application. StatusCast has been designed to accommodate rules-based automation (informed by APM data) and manual communication (i.e. no message goes out automatically), in addition to unfiltered, real-time updates.
Customers respect and appreciate a business that is transparent, accountable, and dedicated to making things more convenient for its customers. This makes the business seem more like a proud provider of genuine value than another off-putting example of the stereotype of the exploitative used car salesman.
“Integrate” does not mean “use simultaneously”; it’s more than that. Integrating your hosted status pages with other software tools allows you to do two things:
1) easily pass information between systems, so you don’t have to copy + paste or worse: recreate from scratch
2) automate, so you only have to set something up once and can trust it to function as designed every subsequent time
The difference between non-integrated and integrated systems is like the difference between mailing a check for your phone or utility bill on time every month vs. setting up an account with auto-payment or one-click payment that can be confirmed, scheduled, and/or updated from any device.
Read more about hosted status pages and hosted status page integrations.
We are excited to announce the Uptime.ly REST API! As with any initial version, we expect you will have suggestions. And when you do, post a response or send us an email.
You can access our REST API knowledge base here: http://bit.ly/19OfuL5
Our goal is to make sure that you can interact with our service in the ways that meets your needs. The API is designed to give you comprehensive access to Uptime.ly functionality. Here are a few ways we anticipate you will find our API useful.
Now for the fun part. You try out our API and give us feedback by 10/31/2013 and we will set you up with an Enterprise account for 1 year. We look forward to learning about how you integrate with Uptime.ly!
© Copyright StatusCast 2022 | Terms & Conditions | Privacy Policy